Oral Health Country/Area Profile Project
Methods and indices
Methods and indices
The WHO manual “Oral Health Surveys – Basic Methods” provides WHO recommended standardized reporting system when conducting national oral health surveys, enabling inter- and intra-country comparisons of oral health status.
WHO Oral Health Surveys, 5th ed, 2013 (PDF)
Caries Prevalence DMFT/DMFS
DMFT and DMFS describe the amount - the prevalence - of dental caries in an individual. DMFT and DMFS are means to numerically express the caries prevalence and are obtained by calculating the number of
- Decayed (D)
- Missing (M)
- Filled (F)
- teeth (T) or surfaces (S)
It is thus used to get an estimation illustrating how much the dentition until the day of examination has become affected by dental caries. It is either calculated for 28 (permanent) teeth, excluding 18, 28, 38 and 48 (the "wisdom" teeth) or for 32 teeth (The Third edition of "Oral Health Surveys - Basic methods", Geneva 1987, recommends 32 teeth).
Thus:
- How many teeth have caries lesions (incipient caries not included)?
- How many teeth have been extracted?
- How many teeth have fillings or crowns?
The sum of the three figures forms the DMFT-value. For example: DMFT of 4-3-9=16 means that 4 teeth are decayed, 3 teeth are missing and 9 teeth have fillings. It also means that 12 teeth are intact.
Note: If a tooth has both a caries lesion and a filling it is calculated as D only. A DMFT of 28 (or 32, if "wisdom" teeth included) is maximum, meaning that all teeth are affected.
A more detailed index is DMF calculated per tooth surface, DMFS. Molars and premolars are considered having 5 surfaces, front teeth 4 surfaces. Again, a surface with both caries and filling is scored as D. Maximum value for DMFS comes to 128 for 28 teeth.
For the primary dentition, consisting of maximum 20 teeth, the corresponding designations are "deft" or "defs", where "e" indicates "extracted tooth".
In caries data for adults, the following designations are used:
- DMFT: Mean number of decayed, missing or filled teeth
- %DMFT: Percentage of population affected with dental caries
- DT: Mean number of decayed teeth
- %D: Percentage with untreated decayed teeth
- MT: Mean number of missing teeth
- MNT: Mean number of teeth
- %Ed: Percentage edentulous
Significant Caries Index (SiC)
A detailed analysis of the caries situation in many countries show that there is a skewed distribution of caries prevalence - meaning that a proportion of 12-year-olds still has high or even very high DMFT values even though a proportion is totally caries free. Clearly, the mean DMFT value does not accurately reflect this skewed distribution leading to incorrect conclusion that the caries situation for the whole population is controlled, while in reality, several individuals still have caries. The Significant Caries Index was introduced in order to bring attention to the individuals with the highest caries values in each population under investigation.
The Significant Caries Index calculation
- Individuals are sorted according to their DMFT values
- One third of the population with the highest caries scores is selected
- The mean DMFT for this subgroup is calculated. This value is the SiC Index.
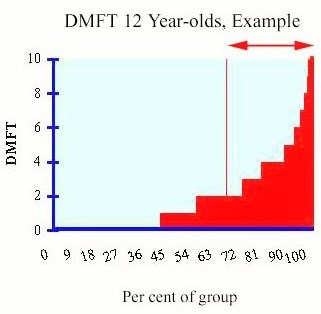
The graph shows caries data for a population, expressed as frequency distribution. In this example, about 45% are caries free (DMFT = 0). The mean DMFT is 1.91, and the Significant Caries Index is 4.61. Arrow and vertical line indicate the individuals that are included in the calculation of the index.
New goal for oral health
In 1981 the World Health Assembly of the WHO declared that the global goal for oral health by the year 2000 should be that the DMFT for the 12-year-olds should not exceed 3. Over a period of twenty years, nearly 70% of the countries in the world have succeeded in achieving this goal, or have never exceeded this borderline value - a great step towards "Health for All".
DMFT describes the amount - the prevalence - of dental caries in an individual and is obtained by calculating the number of Decayed (D), Missing (M) and Filled (F) teeth. The WHO goal thus indicate that a maximum of three teeth as a mean may be affected by caries at the age of 12. However, a low mean caries level such as '3' does not exclude a number of individuals with considerably higher DMFT values in the same population.
For those countries, who still have not reached the WHO/FDI global goal 3 DMFT, this goal is the first priority. As a following step, it has been proposed that the SiC Index for countries should be less than 3 DMFT in the 12-year-olds by the year 2015.
Implications
Focusing attention to the children with highest scores of DMFT with the SiC Index, will lead to significant gains for the society and for the person concerned as more specific targeted preventive actions can be implemented. Obviously, children with high caries prevalence will most likely to be those adults needing complex and expensive treatments in the future. Thus, the general concept is that first the country should reach the WHO goal of 3 or less DMFT for the whole population. The next step is SiC Index of 3 DMFT should be achieved for the one third of the highest caries scores for the population. When the SiC Index is reached for the whole country, one should target provinces, districts, cities and even schools where caries levels are still high - SiC Index is above 3 DMFT. This way, the concept of "Health for All" is strengthened.
SiC Index Manual (PDF)
References
1) Bratthall D. Introducing the Significant Caries Index together with a proposal for a new oral health goal for 12-year-olds, Int Dent J 2000; 50: 378-384.
2) Nishi M. et al. Caries experience of some countries and areas expressed by the Significant Caries Index. Community Dent Oral Epidemiol 2002; 30: 296-301.
Community Periodontal Index (CPI)
Dental fluorosis
Oral Hygiene Index
The Oral Hygiene Index is composed of the combined Debris Index and Calculus index, each of these index is in turn based on 12 numerical determinations representing the amount of debris or calculus found on the buccal and lingual surfaces of each of three segments of each dental arch, namely
- The segment distal to the right cuspid
- The segment distal to the left cuspid
- The segment mesial to the right and left first bicuspids

The Maxillary and the Mandibular arches are each composed of three segments (as illustrated above).
Each segment is examined for debris or calculus. From each segment one tooth is used for calculating the individual index, for that particular segment. The tooth used for the calculation must have the greatest area covered by either debris or calculus.
The method for scoring calculus is the same as that applied to debris, but additional provisions are made for recording subgingival deposits.
Criteria for classifying debris
0 No debris or stain present
1 Soft debris covering not more than one third of the tooth surface, or presence of extrinsic stains without other debris regardless of surface area covered
2 Soft debris covering more than one third, but not more than two thirds, of the exposed tooth surface.
3 Soft debris covering more than two thirds of the exposed tooth surface.
Criteria for classifying calculus
0 No calculus present
1 Supragingival calculus covering not more than third of the exposed tooth surface.
2 Supragingival calculus covering more than one third but not more than two thirds of the exposed tooth surface or the presence of individual flecks of subgingival calculus around the cervical portion of the tooth or both.
3 Supragingival calculus covering more than two third of the exposed tooth surface or a continuous heavy band of subgingival calculus around the cervical portion of the tooth or both.
Calculation example
After the scores for debris and calculus are recorded, the Index values are calculated. For each individual, the debris scores are totalled and divided by the number of segments scored.
The same method is used to obtain the calculus index scores.
The following example shows how to calculate the indices. The scores for debris and calculus should be tabulated separately and indexes for each calculated independently, but in the same manner.
Debris
| Right | Anterior | Left | Total | |||||
| Buccal | Lingual | Labial | Lingual | Buccal | Lingual | Buccal/Labial | Lingual | |
| Upper | 3 | 1 | 2 | 2 | 3 | 1 | 8 | 4 |
| Lower | 2 | 2 | 1 | 1 | 1 | 2 | 4 | 5 |
| Total | 5 | 3 | 3 | 3 | 4 | 3 | 12 | 9 |
Debris Index = (The total of the upper and lower buccal-scores) + (The total of the upper and lower lingual-scores) /(The number of segments scored).
Debris Index = (12+9) / 6= 3.5
Calculus
| Right | Anterior | Left | Total | |||||
| Buccal | Lingual | Labial | Lingual | Buccal | Lingual | Buccal/Labial | Lingual | |
| Upper | 1 | 0 | 0 | 0 | 1 | 0 | 2 | 0 |
| Lower | 0 | 1 | 0 | 2 | 0 | 2 | 0 | 5 |
| Total | 1 | 1 | 0 | 2 | 1 | 2 | 2 | 5 |
Calculus Index = (The total of the upper and lower buccal-scores) + (The total of the upper and lower lingual-scores) / (The number of segments scored).
Calculus Index = (2+5) / 6= 1.16
The average individual or group debris and calculus scores are combined to obtain Oral Hygiene Index, as follows.
Oral Hygiene Index = Debris Index + Calculus Index
3.5 + 1.16 = 4.66
A simplified version exists, the Simplified Oral Hygiene Index (OHI-S by Greene and Vermilion, 1964).
Silness-Löe Index
The measurement of the state of oral hygiene by Silness-Löe plaque index is based on recording both soft debris and mineralized deposits on the following teeth:
Missing teeth are not substituted.
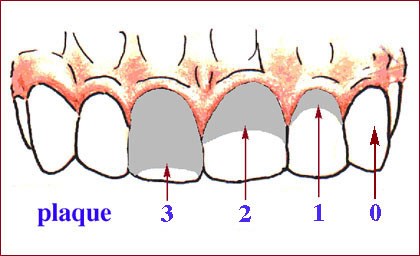
Each of the four surfaces of the teeth (buccal, lingual, mesial and distal) is given a score from 0-3. The scores from the four areas of the tooth are added and divided by four in order to give the plaque index for the tooth with the following scores and criteria:
The Plaque Index System
0 No plaque
1 A film of plaque adhering to the free gingival margin and adjacent area of the tooth. The plaque may be seen in situ only after application of disclosing solution or by using the probe on the tooth surface.
2 Moderate accumulation of soft deposit s within the gingival pocket, or the tooth and gingival margin which can be seen with the naked eye.
3 Abundance of soft matter within the gingival pocket and/or on the tooth and gingival margin.
Calculation example
The following example shows how to calculate the scores for the index.
Assuming a tooth with the following scores on the four surfaces
Buccal 2
Lingual 1
Mesial 1
Distal 2
Plaque Index = (2+1+1+2) / 4 = 1.5, according to the plaque index system this means the plaque index for the tooth is moderate accumulation of soft deposit within the gingival pocket, or the tooth and gingival margin which can be seen with the naked eye.
The indices for the following six teeth may be grouped to designate the index for the group of teeth: 16, 12, 24, 36, 32, 44.
The index for the patient is obtained by summing the indices for all six teeth and dividing by six.
For instance, if you have the following indices for the teeth :
Maxillary right first molar (16) 1.5
Maxillary right lateral incisor (12) 1.3
Maxillary left first bicuspid (24) 1.2
Mandibular left first molar (36) 1
Mandibular left lateral incisor (32) 1.6
Mandibular right first bicuspid (44) 1.3
The index for the patient = (1.5 + 1.3 +1.2 + 1 + 1.6 + 1.3) / 6 = 1.4
Simplified Oral Hygiene Index
The Simplified Oral Hygiene Index (OHI-S) differs from the original OHI (The Oral Hygiene Index) in the number of the tooth surfaces scored (6 rather than 12), the method of selecting the surfaces to be scored, and the scores, which can be obtained. The criteria used for assigning scores to the tooth surfaces are the same as those use for the OHI (The Oral Hygiene Index).
The OHI-S, like the OHI, has two components, the Debris Index and the Calculus Index. Each of these indexes, in turn, is based on numerical determinations representing the amount of debris or calculus found on the pre-selected tooth surfaces.
Selection of tooth surfaces
The six surfaces examined for the OHI-S are selected from four posterior and two anterior teeth.
- In the posterior portion of the dentition, the first fully erupted tooth distal to the second bicuspid (15), usually the first molar (16) but sometimes the second (17) or third molar (18), is examined. The buccal surfaces of the selected upper molars and the lingual surfaces of the selected lower molars are inspected.
- In the anterior portion of the mouth, the labial surfaces of the upper right (11) and the lower left central incisors (31) are scored. In the absence of either of this anterior teeth, the central incisor (21 or 41 respectively) on the opposite side of the midline is substituted.
Criteria for classifying debris
0 No debris or stain present
1 Soft debris covering not more than one third of the tooth surface, or presence of extrinsic stains without other debris regardless of surface area covered
2 Soft debris covering more than one third, but not more than two thirds, of the exposed tooth surface.
3 Soft debris covering more than two thirds of the exposed tooth surface.
Criteria for classifying calculus
0 No calculus present
1 Supragingival calculus covering not more than third of the exposed tooth surface.
2 Supragingival calculus covering more than one third but not more than two thirds of the exposed tooth surface or the presence of individual flecks of subgingival calculus around the cervical portion of the tooth or both.
3 Supragingival calculus covering more than two third of the exposed tooth surface or a continuous heavy band of subgingival calculus around the cervical portion of the tooth or both.
Calculation example
After the scores for debris and calculus are recorded, the Index values are calculated. For each individual, the debris scores are totalled and divided by the number of surfaces scored. At least two of the six possible surfaces must have been examined for an individual score to be calculated. After score for a group of individual is obtained by computing the average of the individual scores. The average individual or group score is known as the Simplified Debris Index (DI-S).
The same methods are used to obtain the calculus scores or the Simplified Calculus Index (CI-S).
The average individual or group debris and calculus scores are combined to obtain the Simplified Oral Hygiene Index.
The CI-S and DI-S values may range from 0 to 3; the OHI-S values from 0 to 6. These values are just half the score magnitude possible with the OHI (Oral Hygiene Index).
The following example shows how to calculate the index. The scores for debris and calculus should be tabulated separately and index for each calculated independently, but in the same manner.
Debris
| Right molar | Anterior | Left molar | Total | |||||
| Buccal | Lingual | Labial | Labial | Buccal | Lingual | Buccal | Lingual | |
| Upper | 3 | - | 2 | - | 3 | - | 8 | - |
| Lower | - | 2 | - | 1 | - | 2 | 1 | 4 |
Debris Index = (The buccal-scores) + (The lingual-scores) / (Total number of examined buccal and lingual surfaces).
Debris Index = (9+4) / 6 = 2.2
Calculus
| Right molar | Anterior | Left molar | Total | |||||
| Buccal | Lingual | Labial | Labial | Buccal | Lingual | Buccal | Lingual | |
| Upper | 1 | - | 0 | - | 1 | - | 2 | - |
| Lower | - | 1 | - | 2 | - | 2 | 2 | 3 |
Calculus Index = (The buccal-scores) + (The lingual-scores) / (Total number of examined buccal and lingual surfaces).
Calculus Index = (4+3) / 6= 1.2
The average individual or group debris and calculus scores are combined to obtain simplified Oral Hygiene Index, as follows.
Oral Hygiene Index = Debris Index + Calculus Index
2.2 + 1.2 = 3.4